Paper: Explaining determinants of bank failure prediction via neural additive model
Authors: Bumho Son, Jaewook Lee, and Hoki Kim
Venue: Applied Economics Letters(2025)
URL: https://www.tandfonline.com/doi/full/10.1080/13504851.2024.2449551
Introduction
Predicting bank failure is essential for maintaining financial stability, and recent advances in machine learning techniques have significantly improved prediction performance. However, the black-box nature of these models remains a critical issue. The opaque internal workings of the models make it difficult to understand and explain prediction results, undermining the transparency and accountability required in the financial sector.
Many post-hoc methods have been used to explain the predictions of black-box models, but these methods have revealed limitations in providing consistent explanations. Such issues can lead to errors in model interpretation not only in finance but across various fields, raising questions about reliability. Recent studies have demonstrated that these post-hoc methods can provide incorrect explanations, which can cause confusion regarding predictive determinants.
“Explaining determinants of bank failure prediction via neural additive model” [Paper] aims to analyze the risks that can arise from using black-box models and post-hoc methods in bank failure prediction, building on these issues. Based on findings from prior research, this study highlights the problem that post-hoc methods fail to consistently explain predictive determinants, and illuminates the model interpretation errors that can result from this.
The Neural Additive Model (NAM) proposed in this study is an innovative approach that provides interpretability while maintaining strong predictive performance. It offers the possibility of overcoming the limitations of existing post-hoc methods and achieving a balance between prediction performance and model transparency. This is expected to contribute to enhancing model reliability in the financial sector and providing clear explanations for regulatory compliance.
Methodology
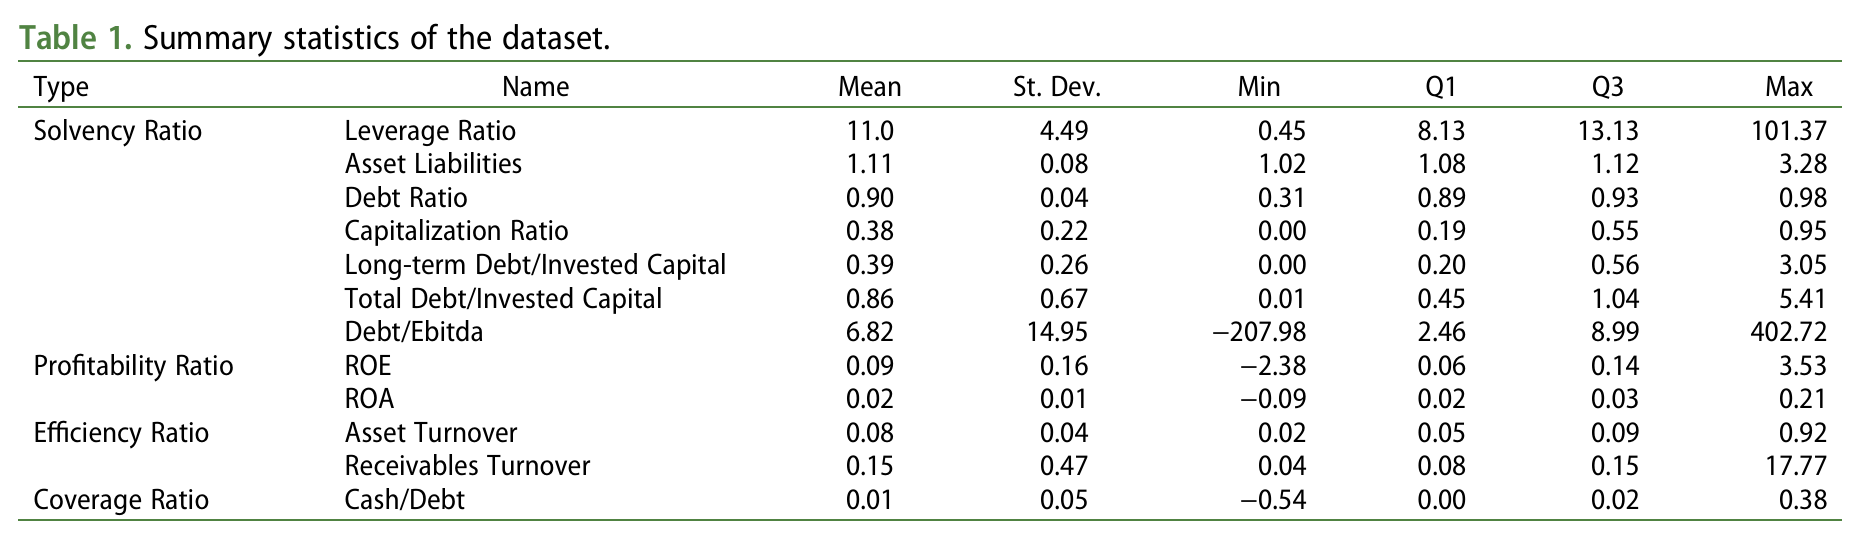
The data used in this study includes 21,243 banks listed on the New York Stock Exchange (NYSE), American Stock Exchange (AMEX), and NASDAQ over the period from January 1969 to September 2021. Key variables for each bank include ROE (Return on Equity), ROA (Return on Assets), and operating expenses to operating revenue ratio, among others. These variables are based on 12 widely used explanatory variables belonging to four categories: Solvency, Profitability, Efficiency, and Coverage Ratios. The data was collected from COMPUSTAT, and 80% was used as training data while 20% was used as test data.
Existing Bank Failure Prediction Models
Existing bank failure prediction models were built using classical statistical techniques until the mid-1970s. They were later extended to machine learning methods such as logistic regression and decision trees, and more recently, complex models such as Support Vector Machines (SVM) and Multi-Layer Perceptrons (MLP) have further improved performance. However, these complex models have limited interpretability.
The failure prediction model is structured as a linear regression model that predicts whether a bank will fail. The model can be expressed as follows:
\[\begin{equation} Prob(y_n = 1|x_{n,k}) = \sum_{k=1}^{K} \beta_k x_{n,k} + \alpha \end{equation}\]Here, \(K\) represents the set of explanatory variables, and \(Prob(y_n = 1 \mid x_n)\) denotes the probability of failure for bank \(n\).
\[\begin{equation} y_n = \begin{cases} 1 : \text{fail} \\ 0 : \text{non-fail} \end{cases} \end{equation}\]\(y_n\) is the target variable indicating whether a bank has failed, where \(y_n = 1\) means failure and \(y_n = 0\) means non-failure.
\(x_{n,k}\) represents the \(k\)-th explanatory variable of bank \(n\), such as assets, profitability, and so on.
The structure of this model is a linear regression model, which multiplies each explanatory variable by its weight and sums the results. In logistic regression, this linear combination is passed through a sigmoid function to produce a probability value between 0 and 1.
In this equation, \(\beta_k\) is the regression coefficient for each explanatory variable, representing the influence of that variable on the target variable. When \(\beta_k > 0\), it increases the probability of failure, and when \(\beta_k < 0\), it decreases the probability of failure.
Bank Failure Prediction Based on the Neural Additive Model (NAM)
Therefore, this study demonstrates that the explainability provided by the structural simplicity of the Neural Additive Model (NAM) maintains a level of interpretability equivalent to that of linear regression, while innovatively improving bank failure prediction performance. This approach holds dual value: solving the black-box problem of complex financial systems while securing prediction accuracy.
Bank failure prediction modeling is formalized in two steps:
\[\begin{align} y_n &= f_1(x_{n,1}) + f_2(x_{n,2}) + \cdots + f_K(x_{n,K}) + \alpha \\ &= \sum_{k=1}^{K} f_k(x_{n,k}) + \alpha. \end{align}\]Here, each function \(f_k\) is constructed as a Neural Network Architecture. Each \(f_k\) is a function independently trained for each variable and depends on a specific explanatory variable \(x\), so interactions between variables are not mixed, allowing the individual influence of each variable to be clearly analyzed. Furthermore, unlike traditional linear models where the slope is simply used as a weight, each variable can undergo complex nonlinear transformations.
According to prior research (Jo & Kim, 2023; Kraus et al., 2024), the Neural Additive Model (NAM) has been confirmed to achieve both high prediction accuracy and explainability across various domains, including time series. Therefore, in this study, we hypothesize that the structural simplicity and independent neural network characteristics of the Neural Additive Model (NAM) can provide explainability advantages similar to linear regression while further improving bank failure prediction.
In this study, various models were used, including logistic regression, decision trees, Support Vector Machines (SVM) with linear kernel and radial basis function (RBF), XGBoost, and Multi-Layer Perceptrons (MLP). Each method underwent hyperparameter tuning through grid search, and our approach adopted a neural network structure with (64, 64, 32) layers.
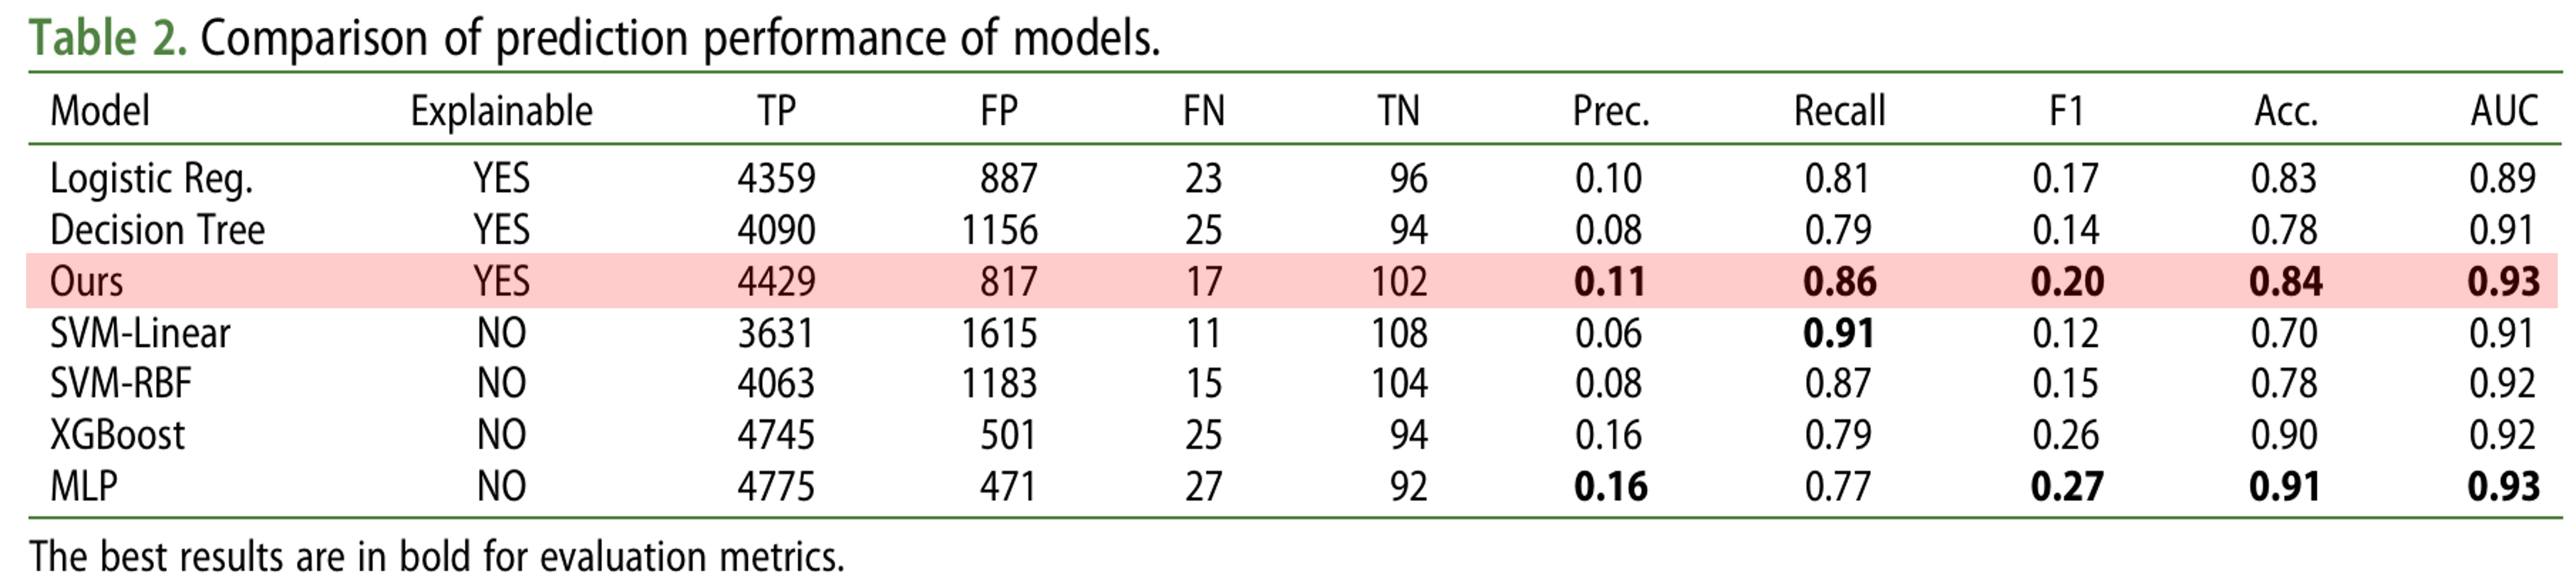
The table above presents results for Precision (Prec.), Recall, F1 Score, Accuracy (Acc.), and AUC (Area Under the Curve). Among explainable models, our model (Ours) outperformed logistic regression and decision tree models across all performance measures. Notably, our model showed comparable performance to other non-explainable models such as SVM and MLP.
These results suggest that the NAM-based approach can simultaneously achieve interpretability and high performance in bank failure prediction.
Experimental Results
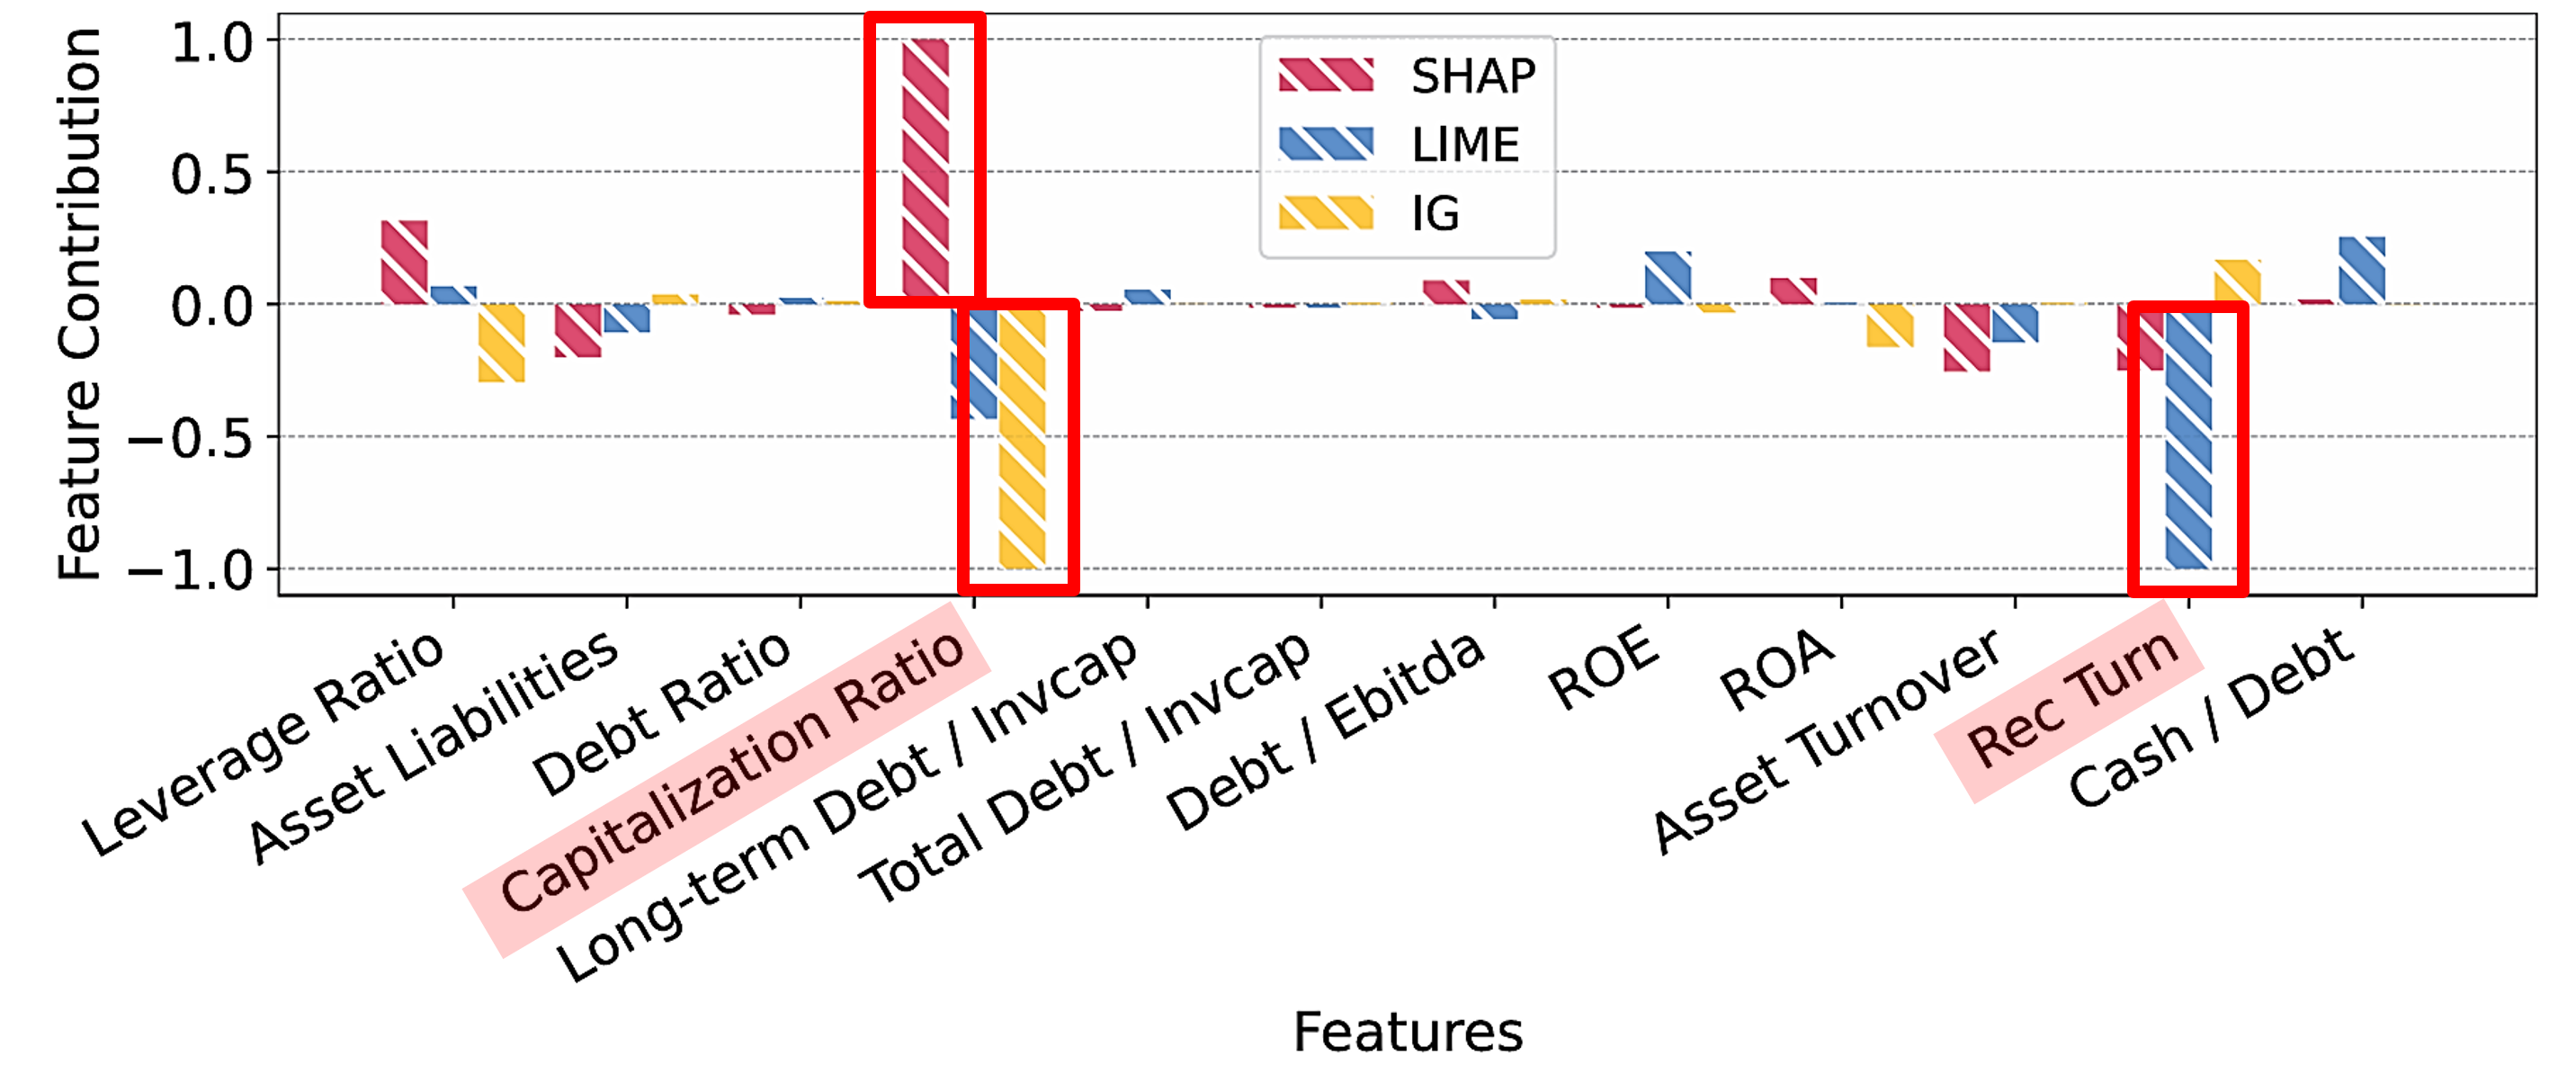
The following graphs show the results of applying post-hoc methods—SHAP (SHapley Additive exPlanations) and LIME (Local Interpretable Model-agnostic Explanations)—to Support Vector Machine (SVM) and Multi-Layer Perceptron (MLP) models, as well as the results of additionally applying Integrated Gradients (IG) to the MLP model.
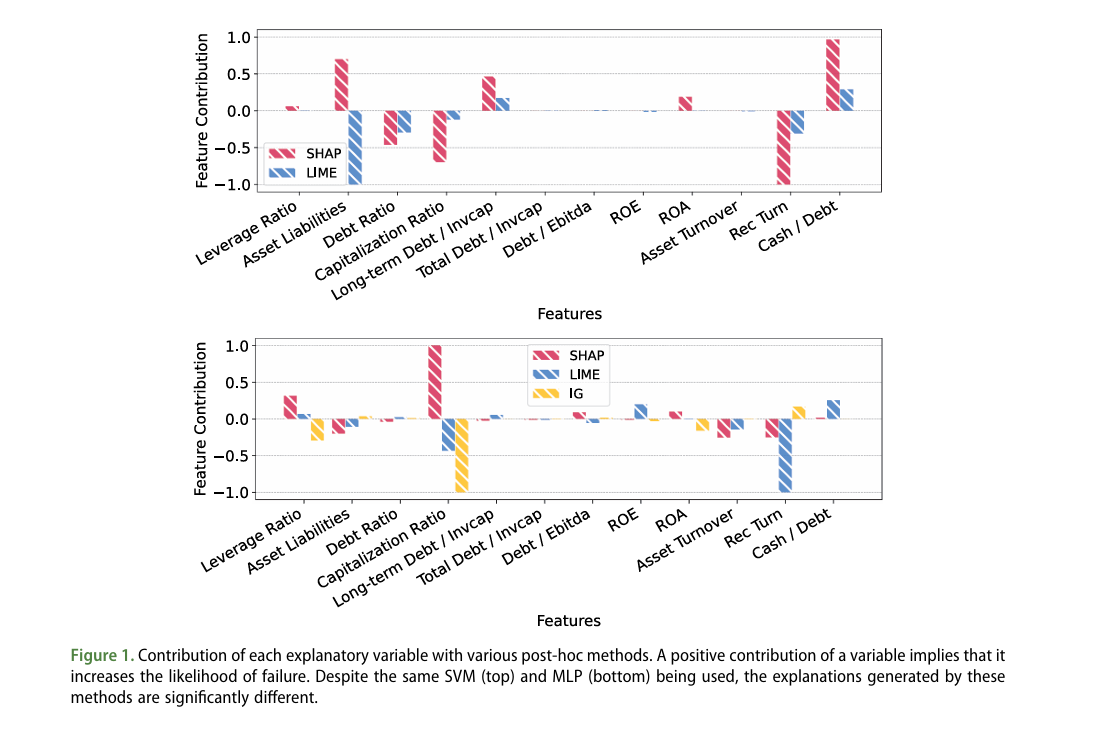
Contributions of Each Explanatory Variable via Various Post-hoc Methods
SVM
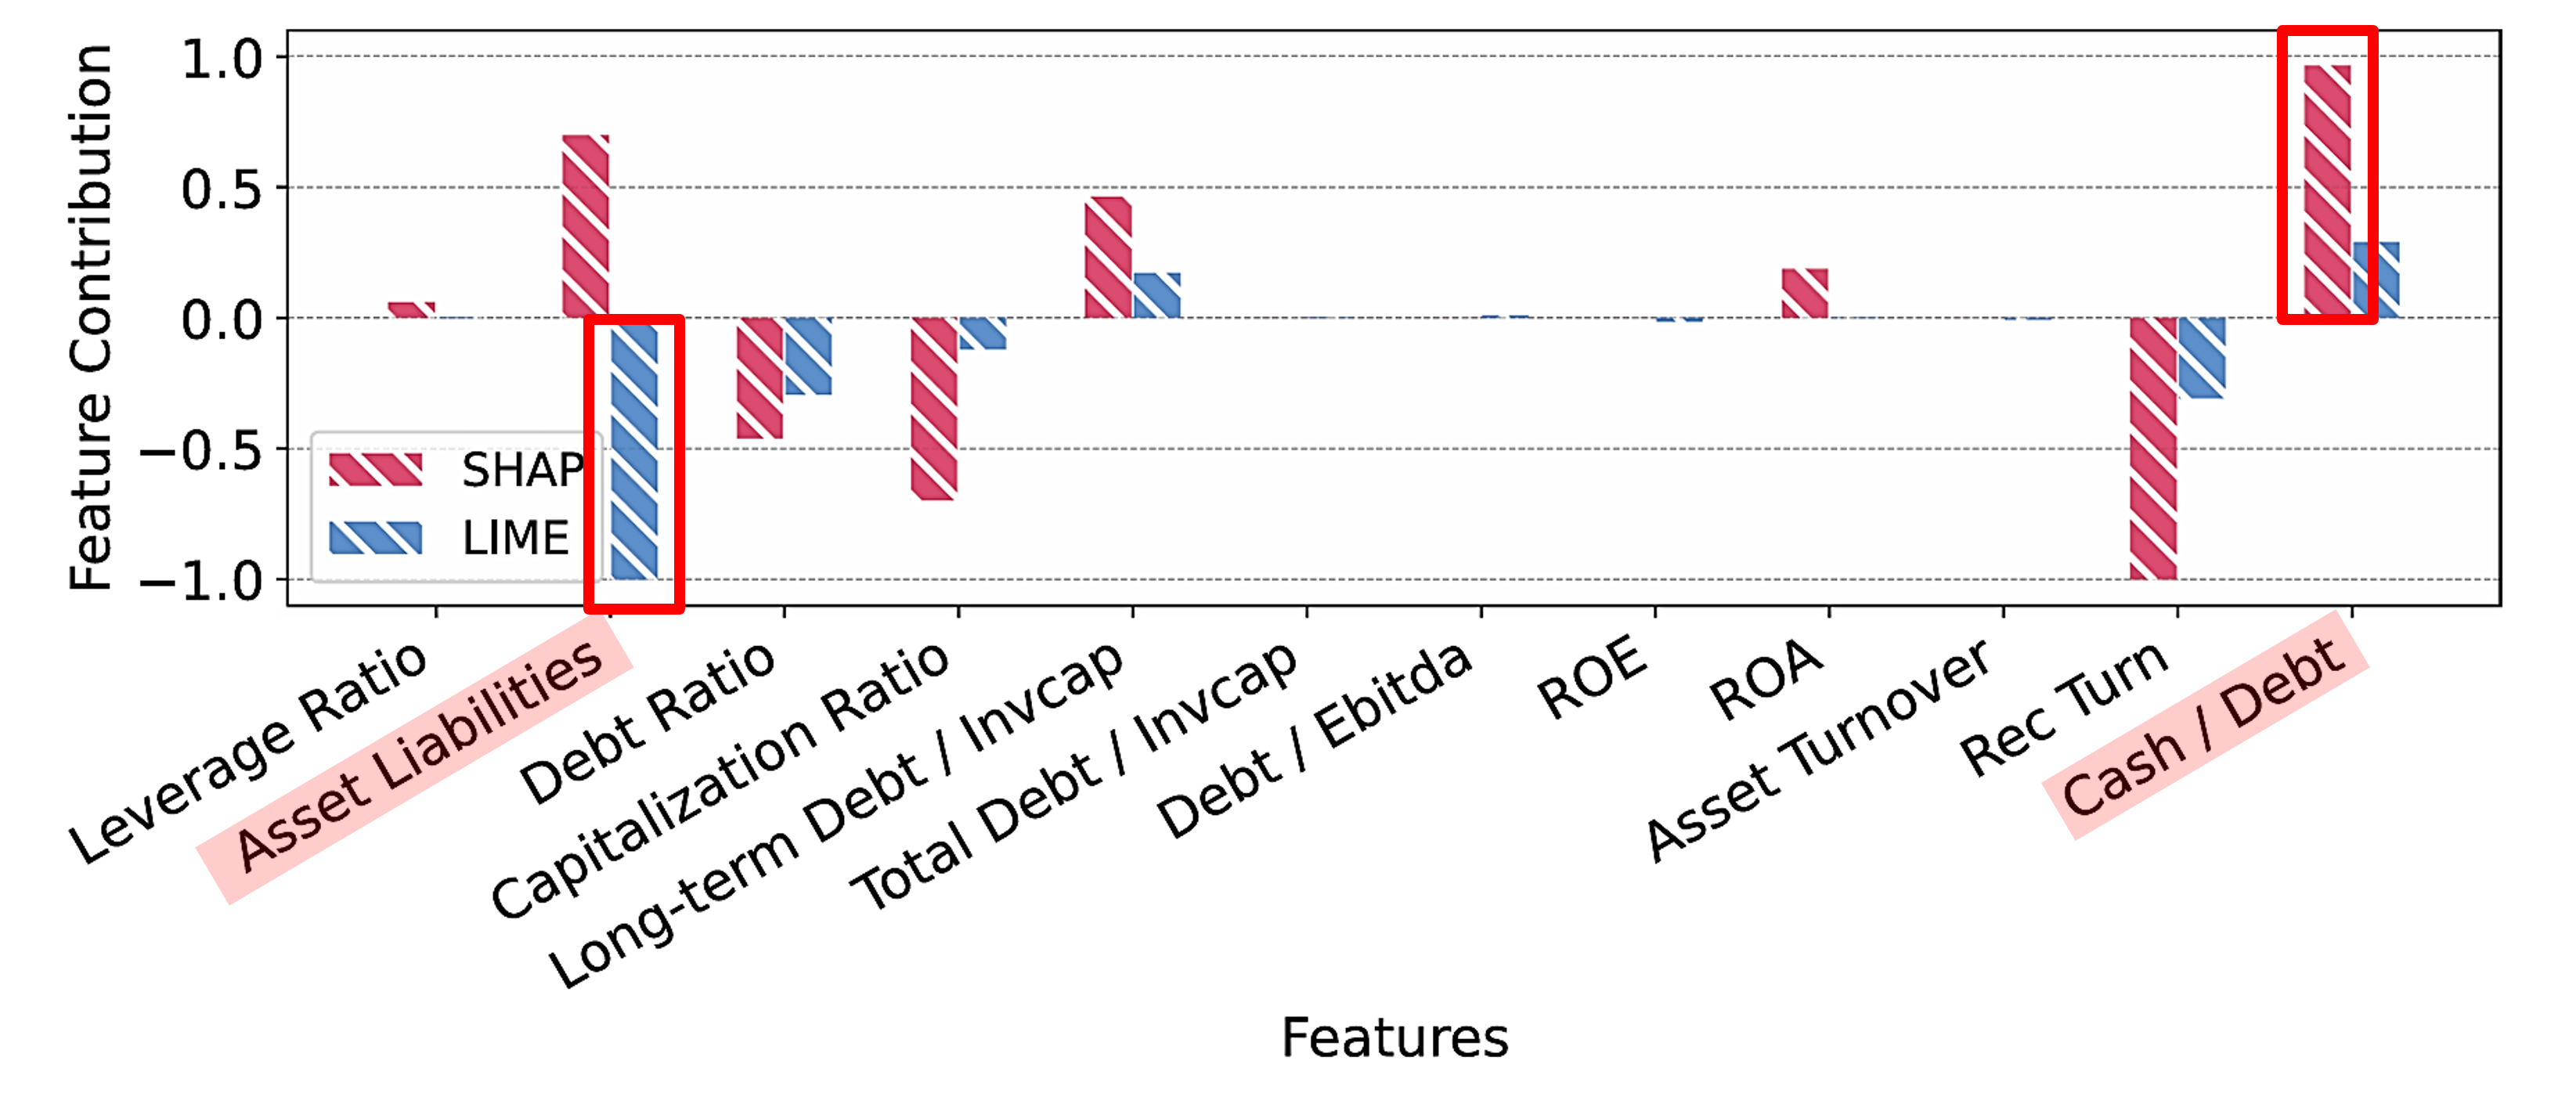
When applying the post-hoc explanation methods SHAP and LIME to a Support Vector Machine (SVM), the figure above shows that SHAP and LIME provide inconsistent explanations. SHAP identifies ‘Cash/Debt’ as the most important feature, while LIME identifies ‘Asset Liabilities’ as the most important feature.
MLP
Similar inconsistencies are observed in the Multi-Layer Perceptron (MLP). These inconsistent explanations highlight the potential risks of using post-hoc methods on black-box models in the financial sector.
Contributions of Each Explanatory Variable to ‘Failed’ and ‘Non-failed’ Banks
The following graphs visually represent the contribution that our proposed Neural Additive Model (NAM)-based model assigns to each variable depending on whether a bank has failed. For the \(y\) values, based on the research by Agarwal et al. (2021), the contribution of each variable \(x_k\) for the entire sample \(N\) is calculated using the following formula:
\[\begin{equation} f_k(x_k) - \sum_{n=1}^{N} \left( \frac{f_k(x_{n,k})}{N} \right) \end{equation}\]Here, \(f_k(x_{n,k})\) represents the influence of individual variable \(x_k\) on the model prediction. A positive (+) contribution can be interpreted as a factor that increases the likelihood of bank failure, while a negative (-) contribution can be interpreted as a factor that decreases the likelihood of failure.
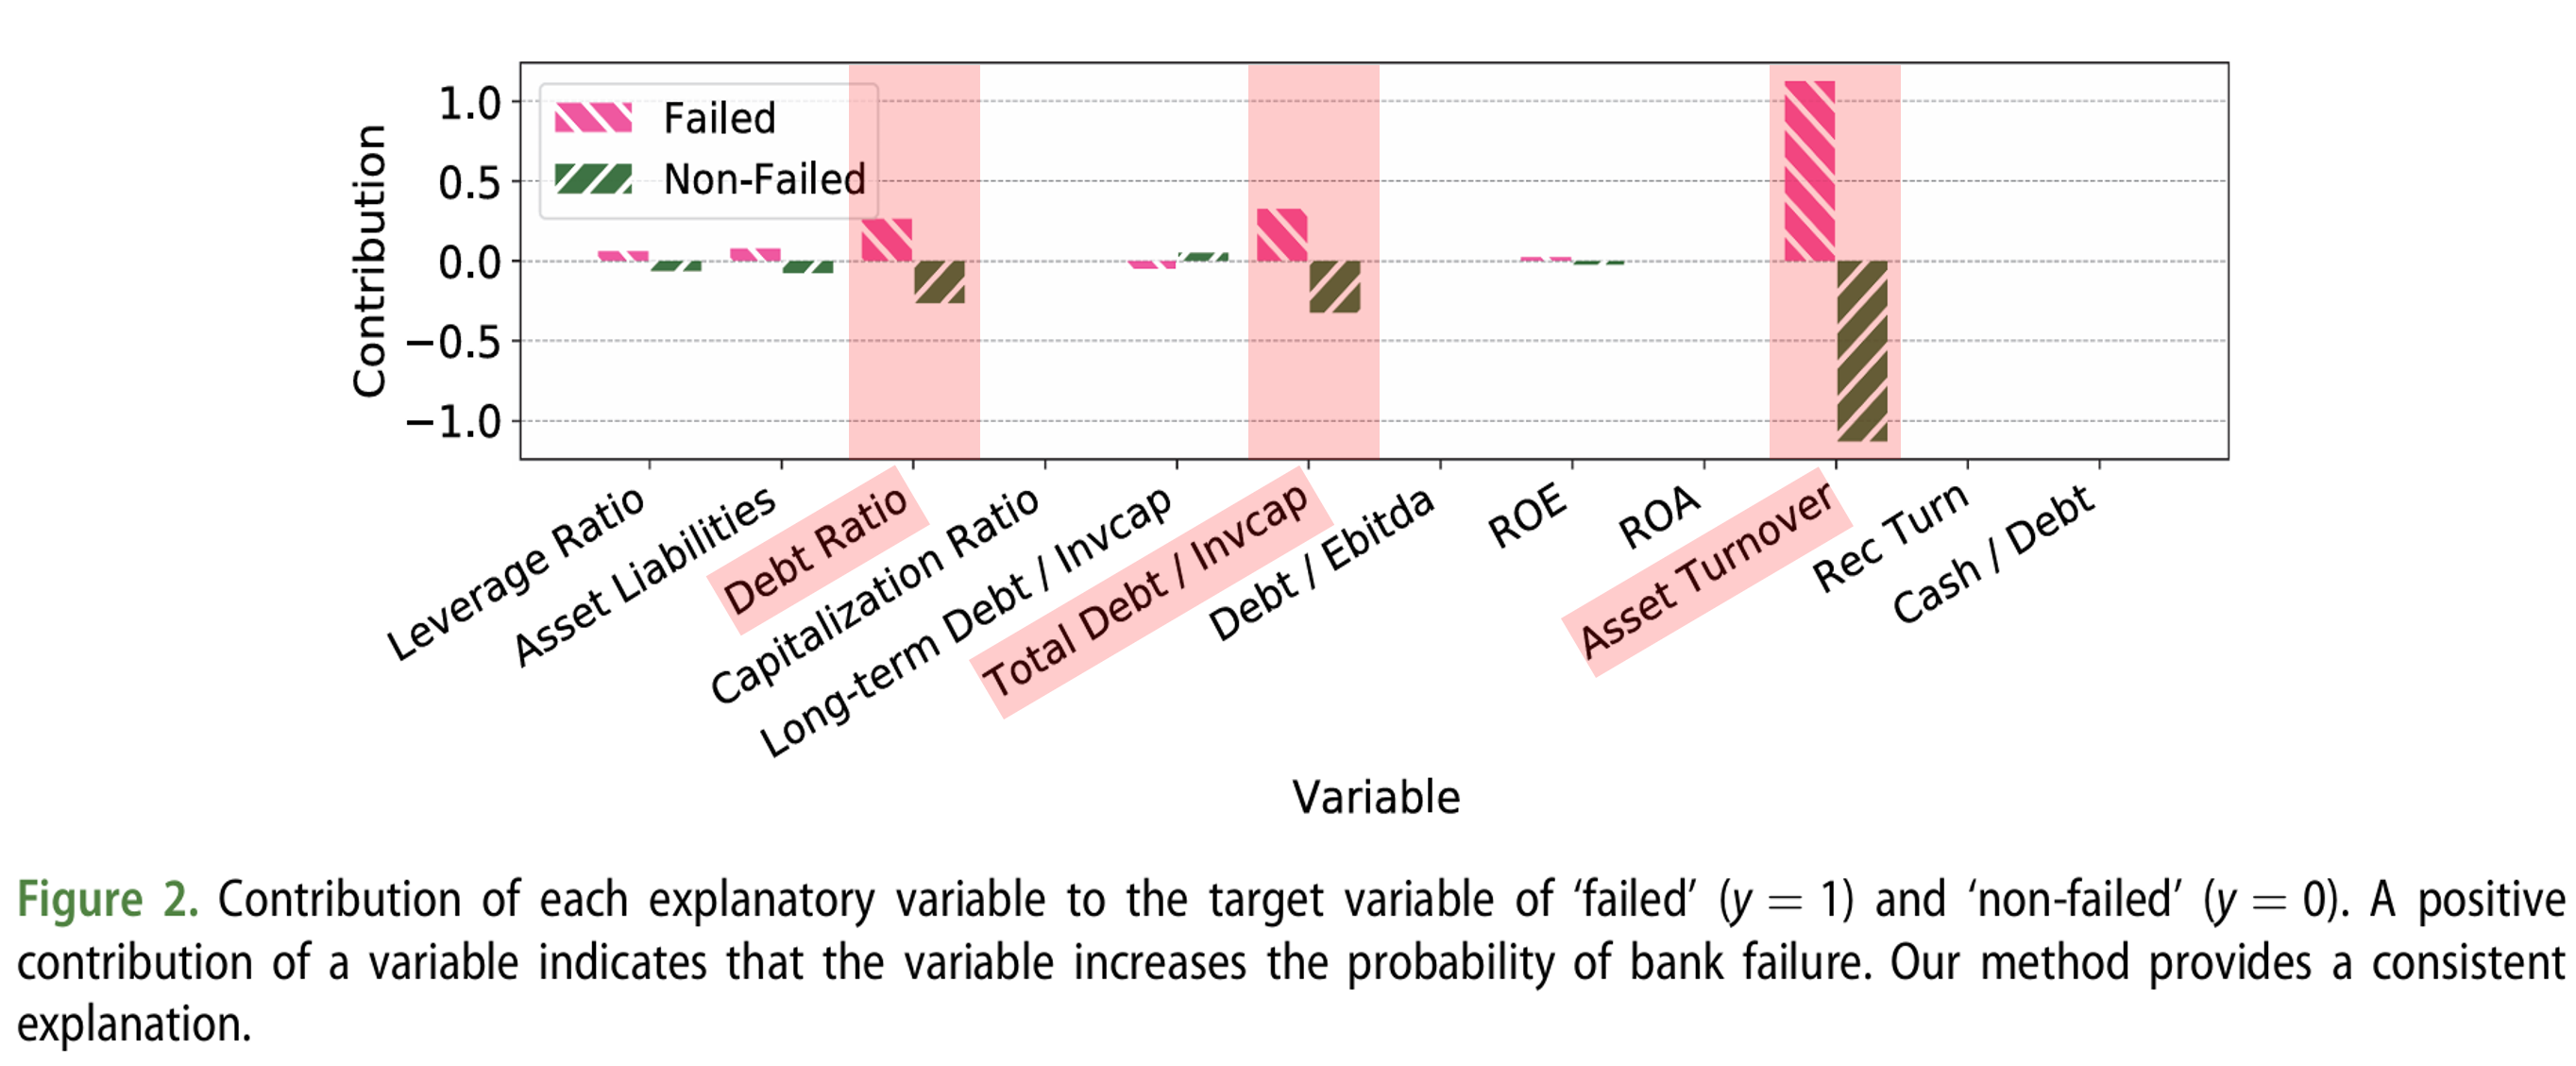
The analysis results show that ‘Asset Turnover’, ‘Total Debt/Invested Capital’, and ‘Debt Ratio’ exhibited high contributions for both failed and non-failed banks.
First, Asset Turnover is an indicator of how efficiently a company utilizes its assets to generate revenue. For failed banks, low asset turnover can be a factor that increases the probability of failure.
Next, Total Debt/Invested Capital is an indicator for evaluating a company’s financial soundness, where excessive debt can increase the risk of failure.
Finally, Debt Ratio is the ratio of debt to total assets, where a higher ratio indicates greater financial risk.
These results are consistent with prior research findings (Beaver 1966) that cash flow and debt ratios are important variables for failure prediction. In other words, the efficiency of a company’s asset utilization, debt levels, and overall financial soundness play important roles in predicting bank failure.
Furthermore, it is noteworthy that ‘Asset Turnover’, ‘Total Debt/Invested Capital’, and ‘Debt Ratio’ showed high contributions for both failed and non-failed banks. This means that these variables comprehensively reflect the financial condition of banks and can serve as important indicators for predicting the probability of failure.
Function Shape \(f_k(x_k)\) and Distribution in High-Density Regions for Important Explanatory Variables \(x_k\)
In this study, we conducted an analysis to verify the actual impact of the variables that the NAM model identified as important for bank failure prediction: ‘Asset Turnover’, ‘Total Debt/Invested Capital’, and ‘Debt Ratio’.
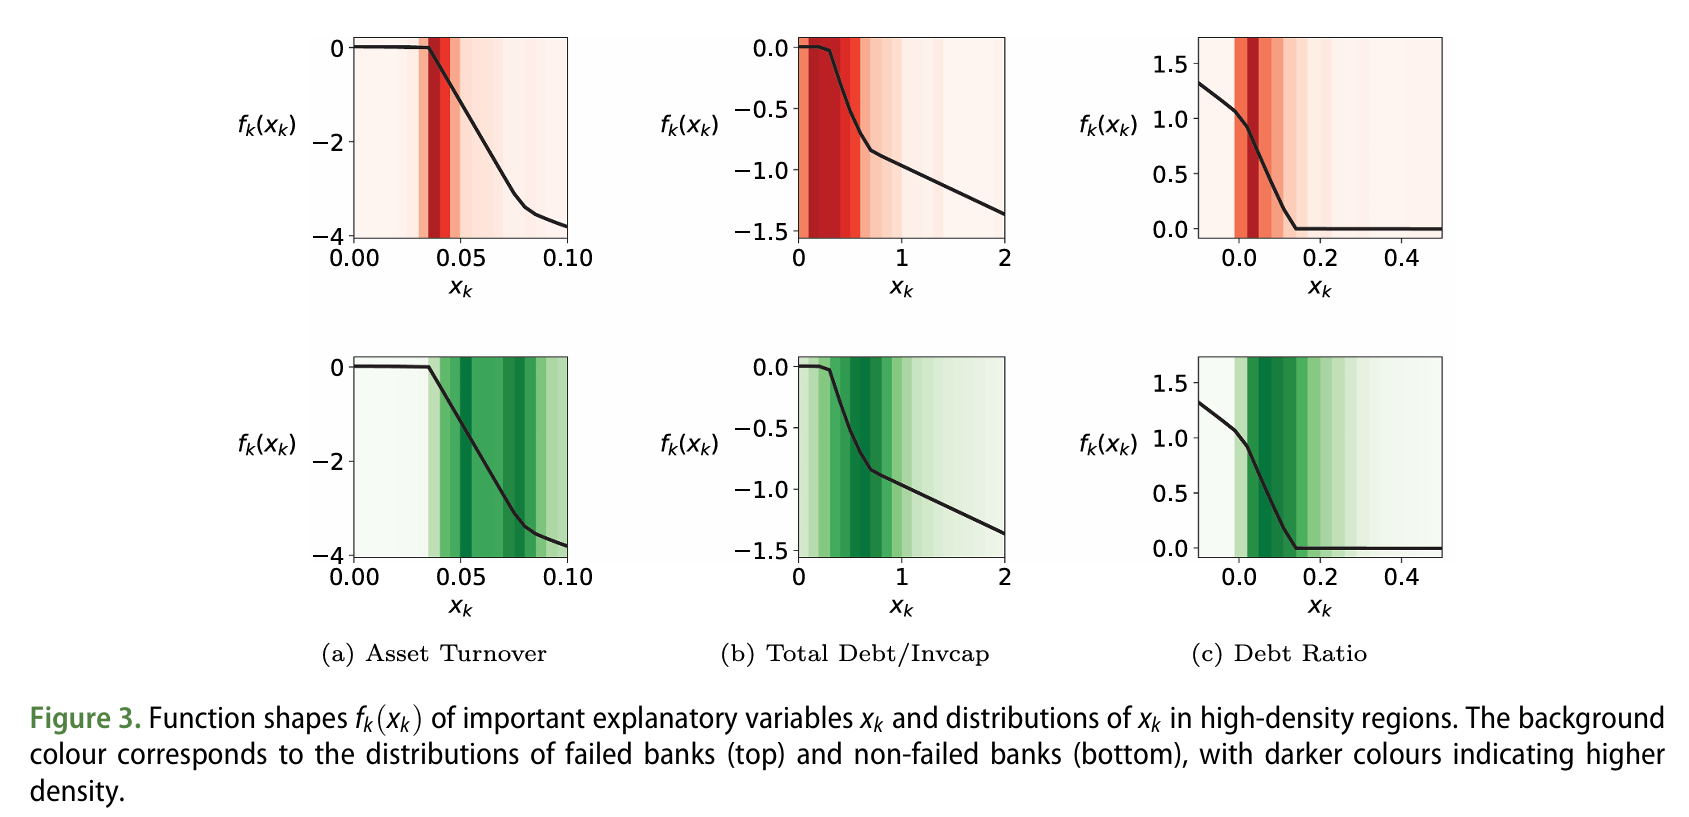
The graph shows the function shapes of the variables identified in Figure 1.
(a) Asset Turnover: Lower values (below 0.05) increase the likelihood of failure, indicating poor asset utilization. Higher asset turnover is associated with lower failure probability, and in practice, non-failed banks show higher density at higher asset turnover values.
(b) Total Debt/Invested Capital and (c) Debt Ratio: For both variables, lower values increase the likelihood of failure. This indicates that higher levels of debt decrease a bank’s stability, with failed banks showing greater density.
The Neural Additive Model (NAM) predicts the probability of failure based on key financial indicators such as asset turnover and debt levels. This model is consistent with prior research findings and effectively reflects the important variables for failure prediction.
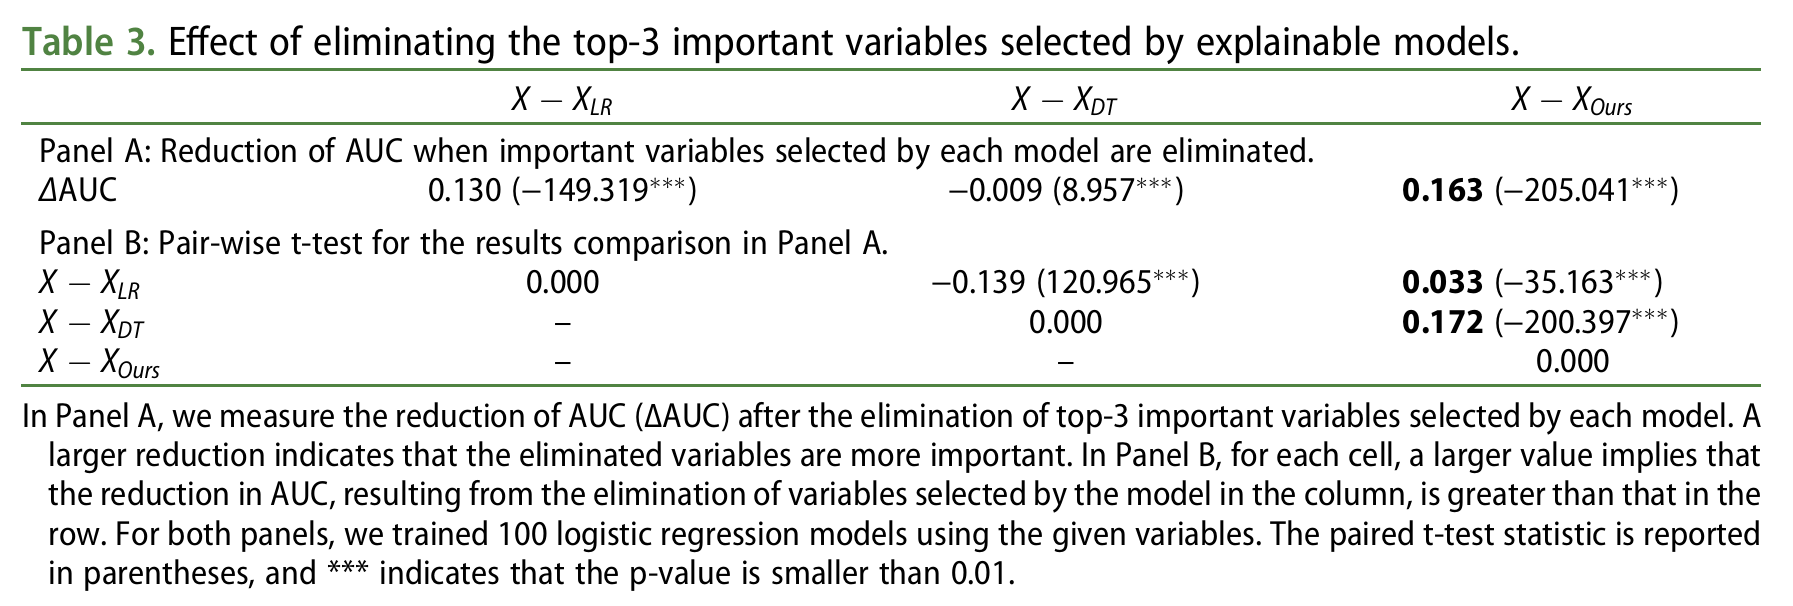
To verify the accuracy of the important determinants identified by each model, the top 3 variables from each model were removed, and AUC was measured using a logistic regression model across 100 random splits. As shown in Table 3, our model exhibited the largest AUC decrease, indicating that it identifies important determinants more accurately than other models.
Panel A shows the results of measuring the AUC decrease (delta AUC) after removing the top 3 important variables selected by each model. A larger decrease indicates that the variables are more important determinants. Panel B compares whether the AUC decrease resulting from removing variables selected by each model is greater than that of other models. Both panels are based on 100 logistic regression model training runs. Paired t-test statistics are presented in parentheses, and *** indicates a p-value less than 0.01.
Conclusion
This study addresses the limitations of post-hoc explanations in black-box models for bank failure prediction. Through empirical analysis, we confirmed that the Neural Additive Model (NAM) not only improves predictive performance but also reliably provides important determinants of bank failure prediction. Finally, we explain the role of each predictor variable and connect these findings to traditional bank failure prediction analysis, providing important insights.
Related Papers
- An Examination of Misclassifications with Bank Failure Prediction Models [Journal of Economics and Business]|[Paper]
- Prediction of Bank Failures [The Journal of Finance]|[Paper]
- Neural Additive Models: Interpretable Machine Learning with Neural Nets [NeurIPS 2021]|[Paper] | [Code]
- Financial Ratios as Predictors of Failure [Journal of Accounting Research 1966]|[Paper]
- Z-altman’s Model Effectiveness in Bank Failure Prediction-The Case of European Banks [Lund University Publications 2017]|[Paper]
- Bank Failure Prediction with Logistic Regression [International Journal of Economics and Financial Issues 2013]|[Paper]